On February 28th, 2026, the United States launched military strikes against Iran. War in the Middle East can have a significant effect on oil prices, but Iran is unique in its relationship to the Strait of Hormuz, a narrow waterway that 20% of the world’s oil must pass through. Iran officially declared the Strait closed on March 4th, 2026, creating a serious oil deficit and spiking prices across the globe.
For American consumers at the pump, how quickly do increased oil costs translate to higher gas prices? Analyzing the percent change of prices rather than the actual dollar amount allows for easy comparison of states in different regions that have significant differences in gas prices normally, such as California and Ohio. The baseline is February 23, 2026, safely one week before the United States strikes on Iran began, meaning the percent change on this date was zero. The data is collected weekly, indicated by a point, so while it appears prices began to rise before the strikes, this interpretation is false and only appears that way because the next data collection did not occur until after the strikes.
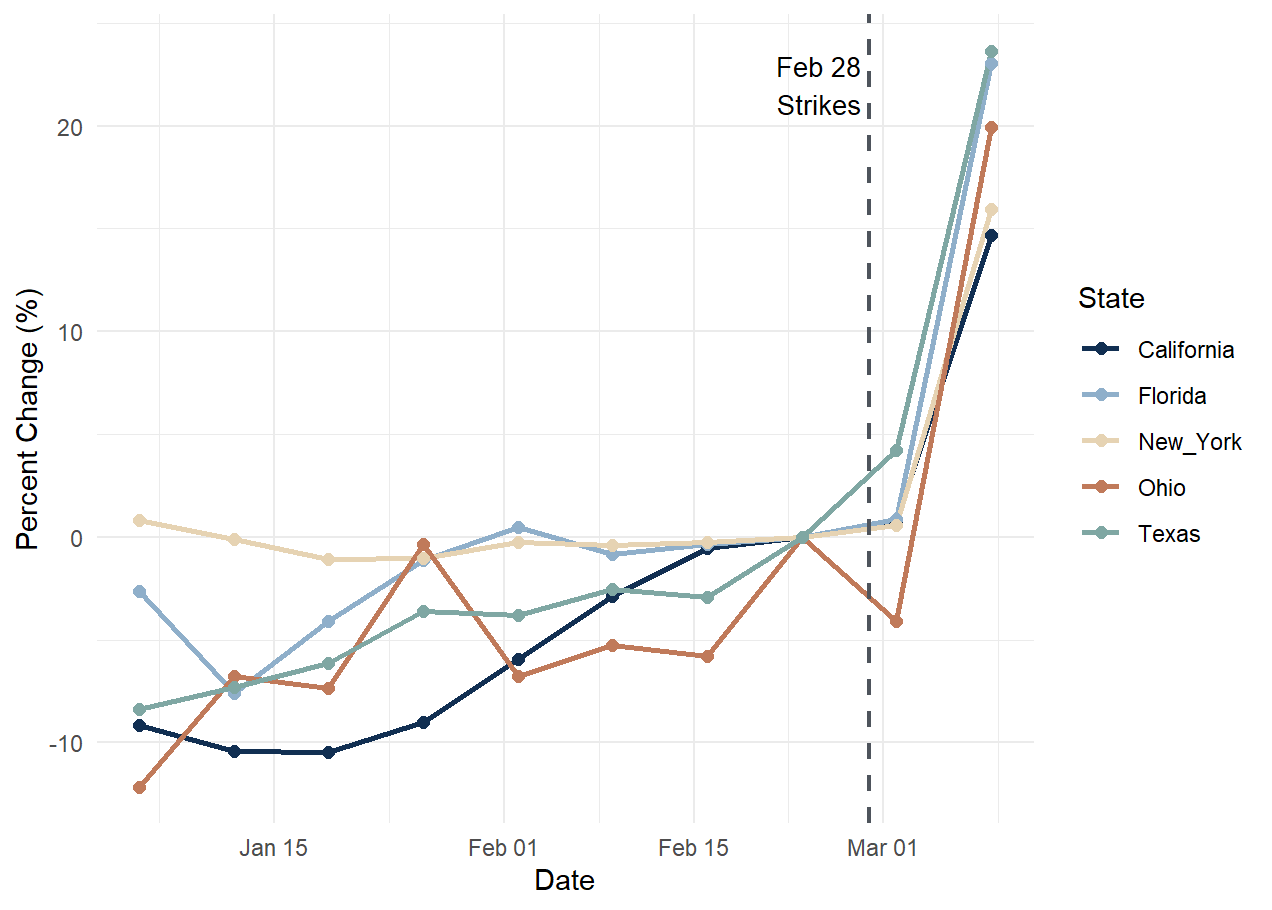
Figure 1 shows the percent change in gas price for five states, California, Florida, Texas, New York, and Ohio, relative to their February 23rd baseline. These states were chosen to represent southern, western, midwestern, and northeastern regions of the United States and paint a broader picture of how location may affect state price responses. Interestingly, Ohio’s gas prices fell by 4.1% immediately after the strikes, but proceeded to have one of the larger increases as prices rose 20.0% by the following week. Texas had the highest percent change of the five states with a 23.6% increase by March 9th. California had the smallest change, with just a 14.7% increase by March 9th, likely because its gas prices are normally elevated in comparison to the rest of the country. Raw price changes, rather than percent changes, might better reflect the impact on consumers.
The overall trend is clear; just days after the conflict began, state gas prices increased slightly across the country, and proceeded to skyrocket the following week. Within two weeks of the strikes, gas prices had increased to around 15-20% at the state level.
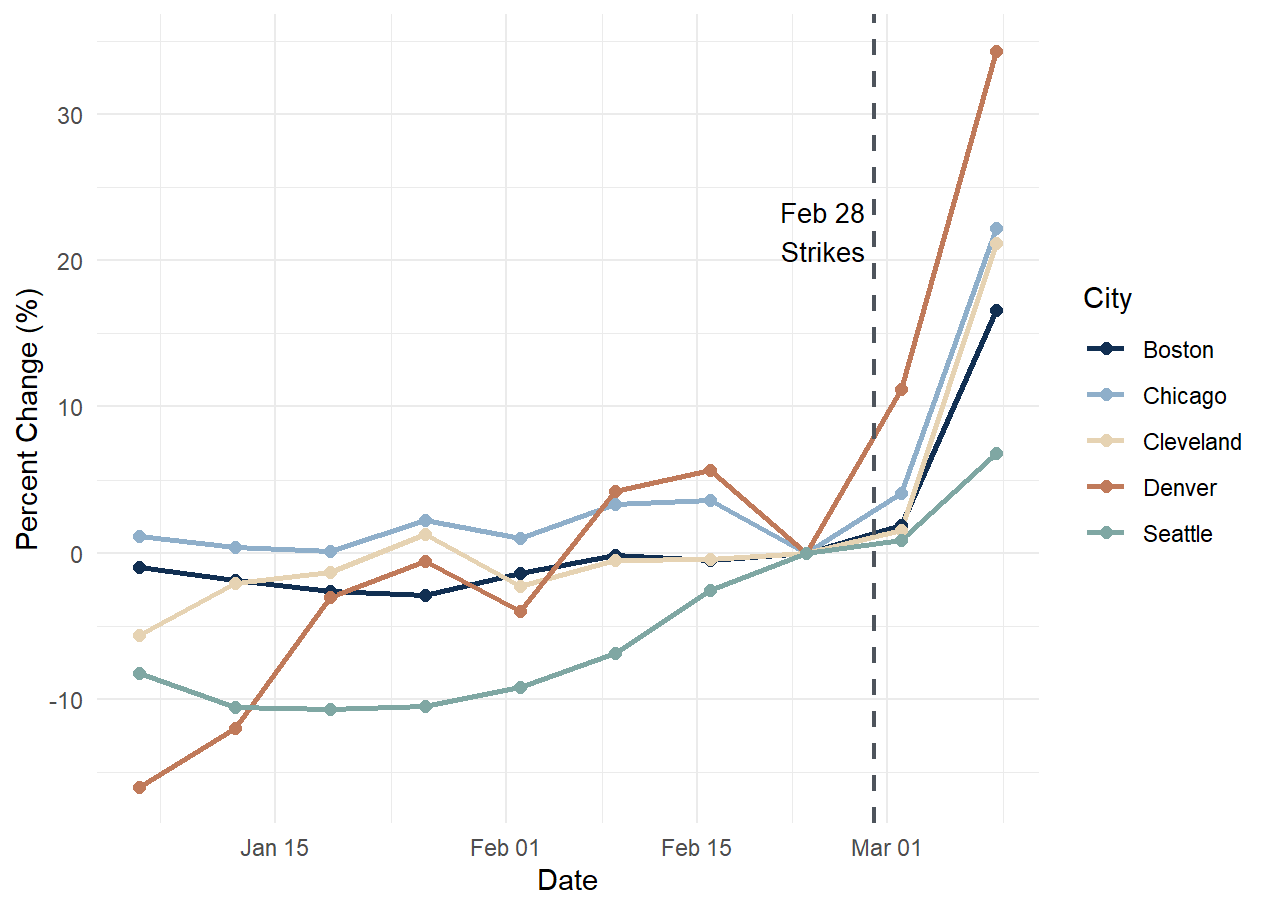
Prices at the city level share a similar story. Figure 2 analyzes the percent change in Boston, Chicago, Cleveland, Denver, and Seattle. Aside from Cleveland, Ohio, the cities are from different states than previously mentioned and are spread across the unique regions of the United States. Denver, Colorado, had the hardest response after the strikes, with an 11.2% increase in gas prices immediately afterwards, and a 34.3% increase by March 9, 2026. Seattle responded the least of the five cities, with hardly any change in prices immediately after with a 6.8% increase on March 9th.
From a regional perspective, Figure 1 displays that the two southern states had the most significant jump in prices, followed by the Midwest and Northeast, with western California experiencing the smallest percent change by a slight margin. However, Figure 2 demonstrates that because of the vast size of the United States, two places that are considered to be in the same region can have significantly different price experiences. While the Midwest and Northeast cities had comparable percent changes to the states in their regions, the two western cities, Denver and Seattle, had both the largest and smallest changes in gas prices, respectively. By March 9th, Denver’s gas prices had increased 27.49% more than Seattle despite them both being Western cities. Similar to state prices, the cities had a small immediate uptick in prices after the strikes, and ranged from 15-30% increases in prices within two weeks.
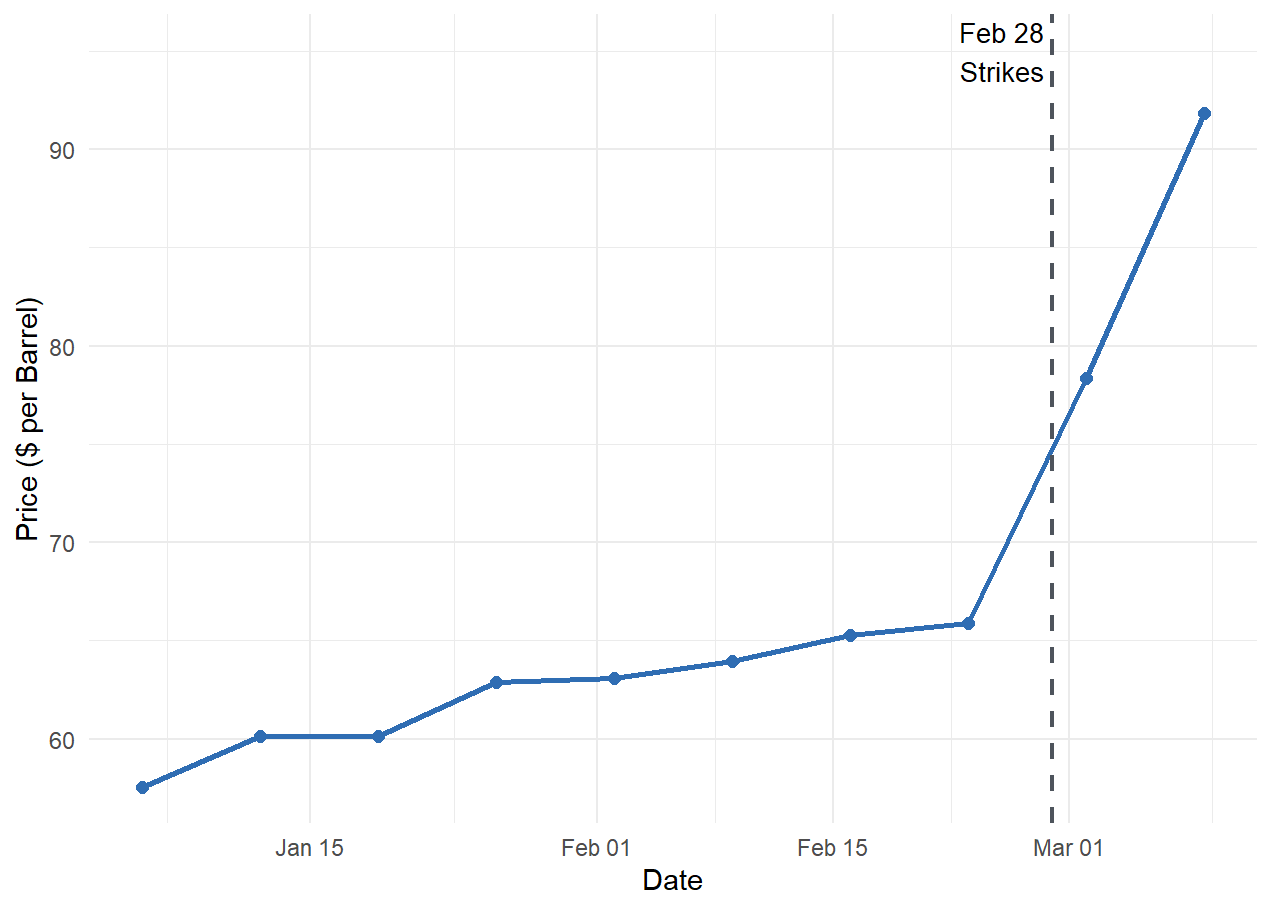
Looking at Figure 3, oil consistently cost around $60-$65 per barrel in January and February. Directly after the strikes, it jumped to nearly $80 a barrel, a 20% increase from the February 28th baseline, and then above $90 the following week, a 40% increase. Considering that the gas price data was taken March 2nd and 9th, while the oil price data was taken March 6th and 13th, it is difficult to determine if gas and oil prices were changing at the same rate. Gas prices in the states and cities appear to be changing similarly, although the cities have a broader range of percent increases than the states. Texas was the highest of the states with a 23.6% increase, and Denver was the highest city with a 34.3% increase, both by March 9th. Only four days later, oil prices had increased by 40%, potentially indicating that gas prices were delayed in responding to the increased oil costs. Meanwhile, the slowest reacting of the states and cities, California with a 14.7% increase and Seattle with a 6.81% increase in gas prices by March 9th, appear considerably behind in their updating to new WTI oil prices.
Gas prices in the United States respond almost immediately to military conflict in the Middle East. Region can be some indicator of how quickly a state will increase their prices, but individual cities vary greatly even within the same region and on a broader scale. Two Western cities, Denver and Seattle, differed in their increases by over 27 percentage points. Even the areas fastest at updating gas prices are days behind at best when oil price per barrel surges by 40% within two weeks. As conflict in Iran and the Strait of Hormuz closure continue, Americans will be on the losing end of the race to elevate prices at the pump.