A shared upward trend
Housing markets are often assumed to reflect local conditions. Cities that attract residents should experience stronger price growth, while those losing population should fall behind. Across Ohio, however, the evidence points to a more unified pattern.
Cities are divided into three groups based on population change between 2010 and 2024. Fast-growing cities expand by more than 1% annually, moderate cities fall between -1% and 1%, and declining cities shrink below -1%.
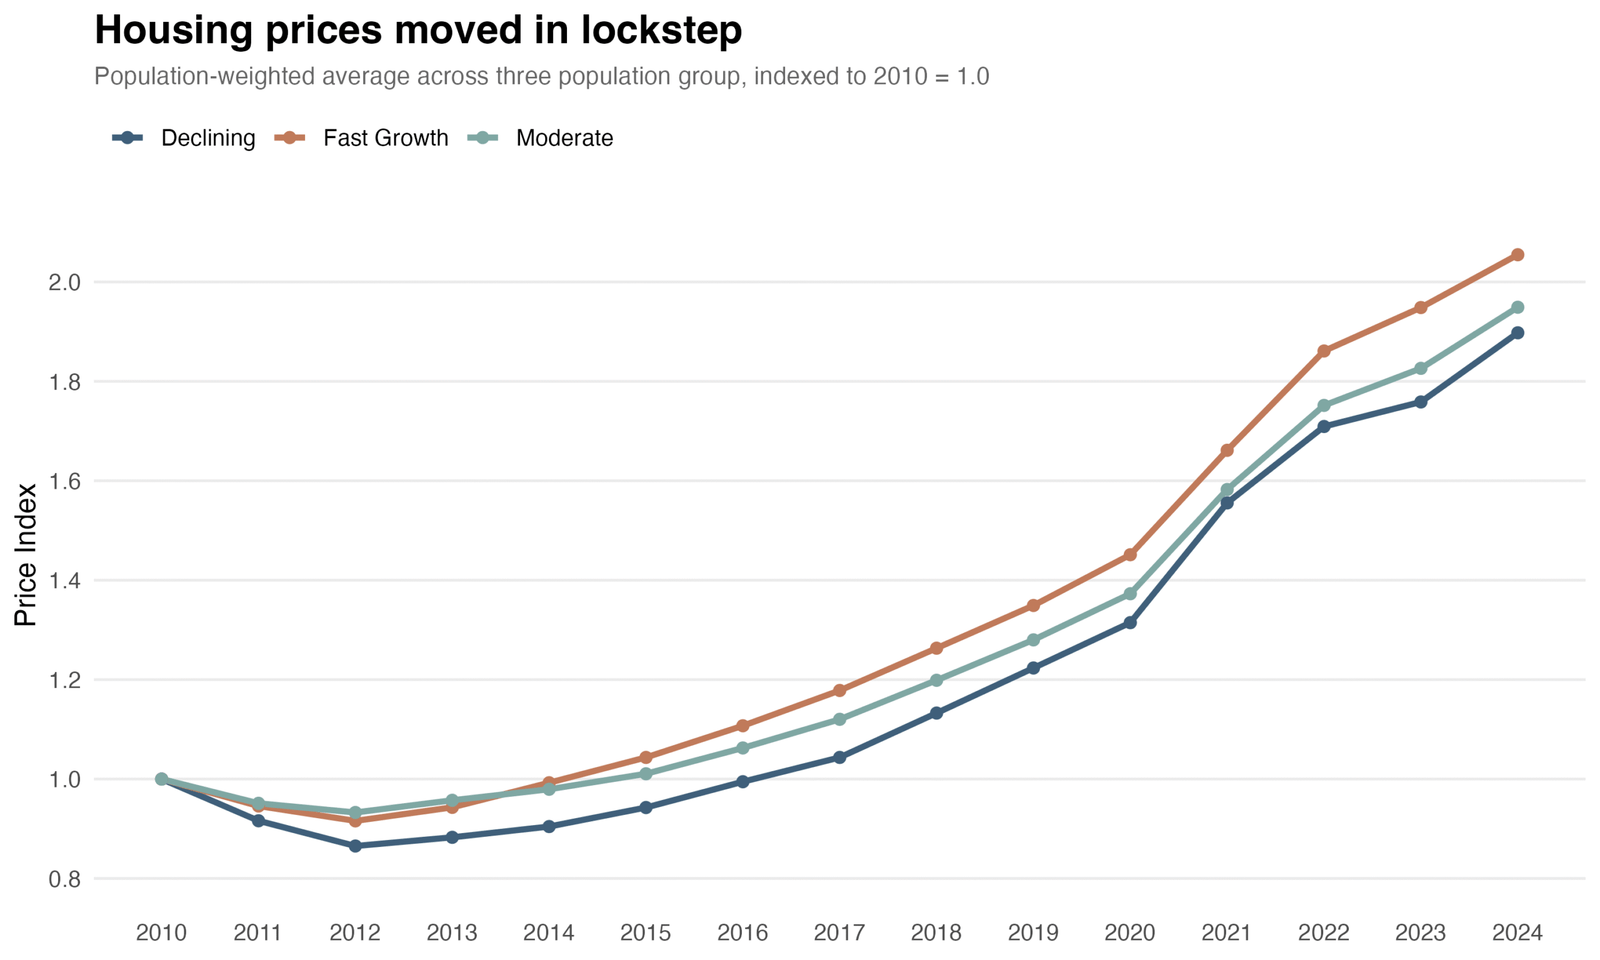
The chart presents population-weighted housing price indices for each group, indexed to 2010. All three series follow remarkably similar trajectories. Prices dip slightly in the early 2010s, recover steadily through the decade, and accelerate sharply after 2020.
The degree of synchronization is notable. Turning points occur at nearly identical moments across all groups, and the pace of growth remains closely aligned throughout the period. This suggests that housing markets across Ohio respond primarily to common, statewide forces rather than to local demographic variation.
Differences do emerge, though they are limited in magnitude. Fast-growing cities consistently record slightly higher price levels, indicating somewhat stronger cumulative growth. Declining cities tend to trail modestly behind. Yet by the end of the period, these gaps remain narrow relative to the overall increase in prices.
Population growth alone does not account for the trajectory of housing prices in Ohio. Instead, broader macroeconomic conditions appear to dominate. Persistently low interest rates, constrained housing supply, and shifts in demand following the pandemic likely contributed to the widespread and simultaneous rise in prices across all city groups.
A smoother story than reality
While group averages suggest a uniform pattern, they obscure meaningful variation at the city level.
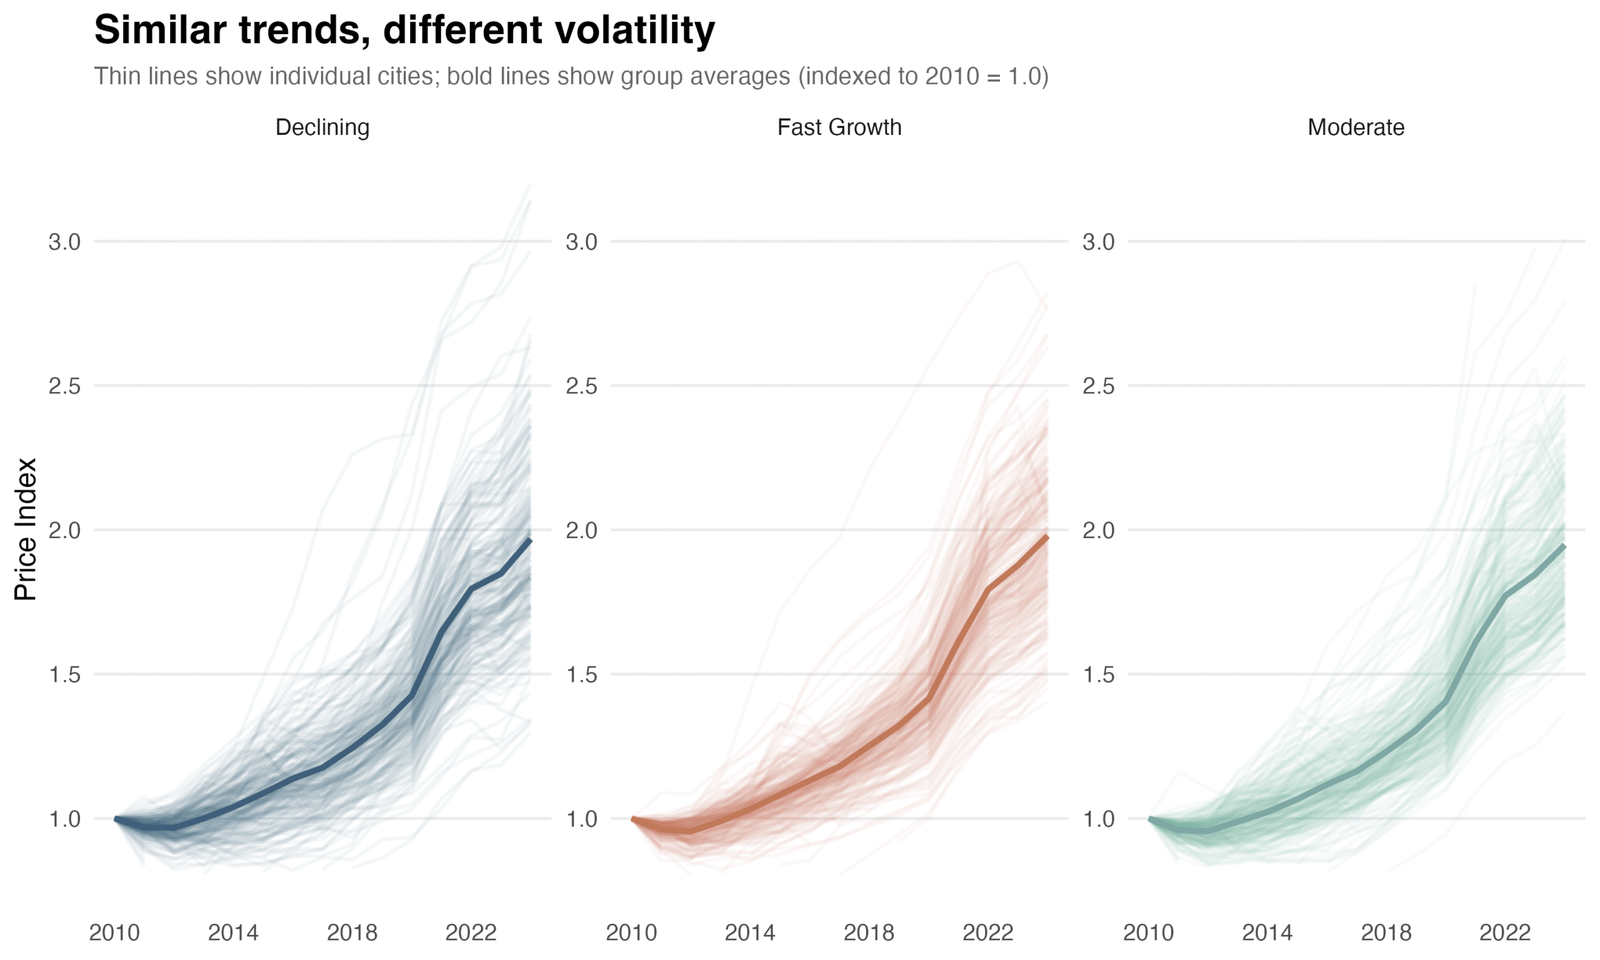
This chart displays individual city housing price indices as thin lines, with group averages (unweighted) shown in bold. Across all three panels, the overall pattern remains consistent: each group approximately doubles relative to its 2010 level, with a pronounced acceleration after 2020.
At the same time, dispersion within each group becomes evident. Individual price paths diverge, particularly in the later years, as some cities experience faster appreciation while others lag behind. The spread of outcomes widens over time, reflecting increasingly heterogeneous local experiences.
There are modest differences across groups. Declining cities exhibit a somewhat wider dispersion, suggesting greater variability in price trajectories. Fast-growing cities appear more tightly clustered, indicating more consistent outcomes across locations. Moderate-growth cities lie between these two cases.
However, these distinctions should not be overstated. The distributions overlap substantially, and no group displays markedly different volatility. The dominant feature of the chart remains the common upward movement rather than divergence between groups.
This points to an important conclusion. Local factors do influence housing outcomes, but their effects are secondary and uneven. Differences in housing supply constraints, development patterns, and local demand conditions likely explain variation within groups. Yet these factors operate within a broader environment that pushes prices upward across the entire state.
Why does this pattern emerge?
The evidence suggests a layered explanation.
At the aggregate level, macroeconomic forces shape the overall direction of housing prices. Interest rates, financing conditions, and statewide supply constraints affect all markets simultaneously, producing the synchronized trends observed across city groups.
At the local level, variation arises from differences in housing supply responsiveness, zoning regulations, and neighborhood-specific demand. These factors generate dispersion within groups, even when the broader trend is shared.
Population growth plays a role, but a limited one. It contributes to small differences in price levels and variability, but it does not fundamentally determine the trajectory of housing prices.
A synchronized but uneven market
Ohio’s housing market is both cohesive and differentiated. Prices rise in parallel across cities, largely independent of population trends.
Yet beneath this shared trajectory lies a degree of variation. Individual cities follow distinct paths, and dispersion increases over time, particularly during periods of rapid growth.
Even so, these differences remain secondary. The defining characteristic of Ohio’s housing market over this period is not divergence, but synchronization. Prices move together, shaped more by common forces than by local demographic change.
(U.S. Census Bureau 2024) (U.S. Census Bureau 2025) (Zillow Research 2026)